
& Analytics
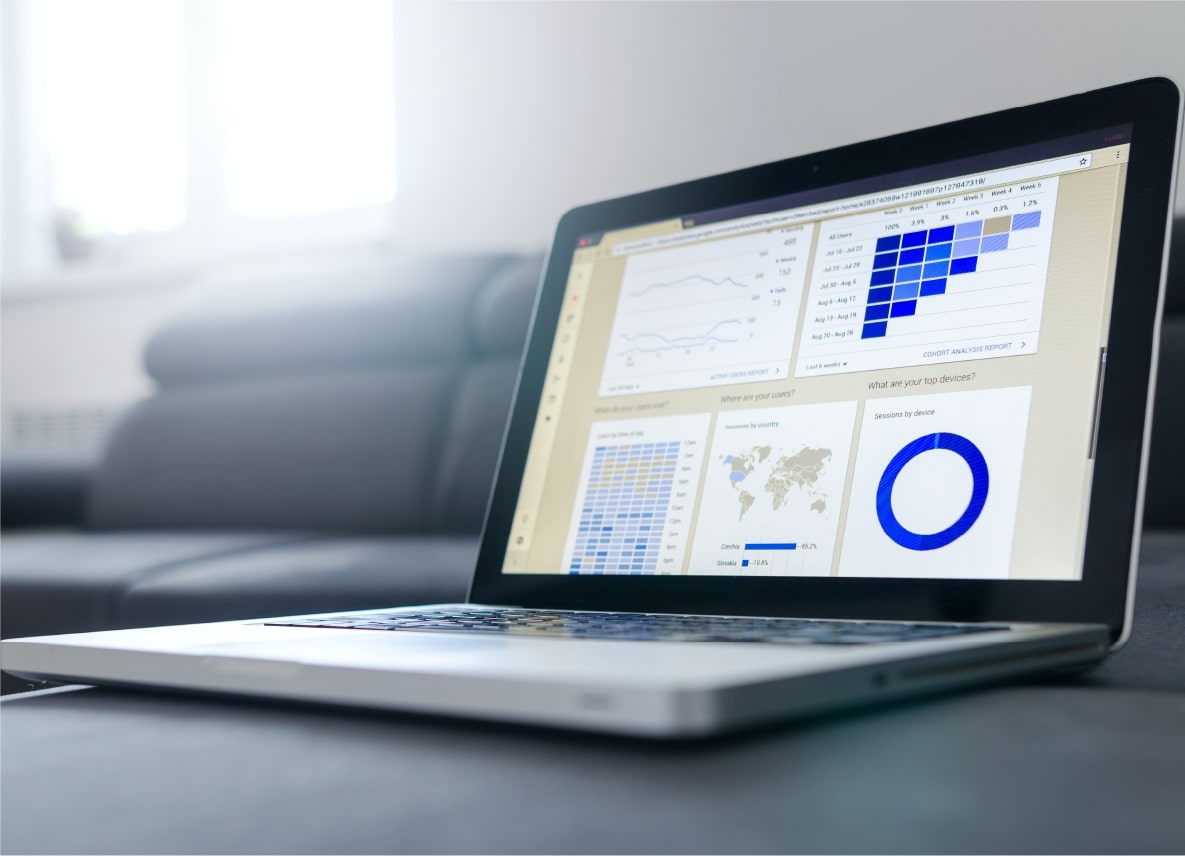
Most tools have filters that can be applied to manipulate the data to fit users’ requirements. Highly insightful 3d visualisations have recently supplanted traditional forms of visualisation, such as charts, tables, line graphs, column charts, among others.
Data analytics represents the next step in data visualisation, identifying or discovering inherent trends and patterns in the data.
Data visualisations, while allowing users to make sense of the data, do not necessarily provide acomplete picture. The effectiveness of visualised data is limited by the data used to prepare the visualisation in the first place. Feeding visualisation engines with incomplete data will render half-baked, obsolete, or erroneous visualization.
While visualisation tools are mostly utilised when working with with raw and unstructured data, end-to-end analytic tools employ data mining algorithms to cleanse the data. Thereafter, the cleansed data is evaluated using different evaluation models and software tools, subjected to algorithms, and decisions on how to display the data are then made.
Using a data-driven approach, companies can examine and organise their data so that they can better serve their customers and consumers. By using data to drive its actions, an organisation can contextualise and personalise its message to its existing and prospective customers for a more customer-centric approach.
Tableau
Tableau combines interactive visuals and powerful analytics to help organisations make sense of data. Its flexibility makes it easy for organisations to adopt and adapt Tableau to their specific data needs.
Kafka
Kafka is used to build real-time data pipelines and streaming apps. It is horizontally scalable, fault-tolerant, fast, and runs in production in thousands of companies.